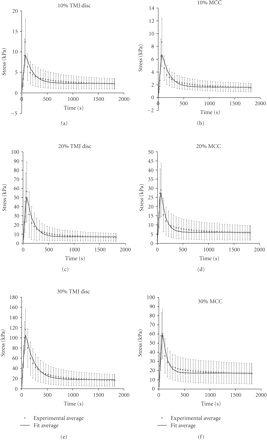
Figure 3:
Average stress response of TMJ disc (a, c, and e) and MCC (b, d, and f) to 10%, 20%, and 30% strain and curve fit. The experimental average is the average stress response of all specimens with the error bars indicating standard deviation. The fit average was obtained by determining the best fit parameters for the average stress response.


