- Institution: Stanford Univ Med Ctr Lane Med Lib/Periodical Dept/Rm L109
- Sign In as Member / Individual
PROMISCUOUS LIGANDS AND ATTRACTIVE CAVITIES

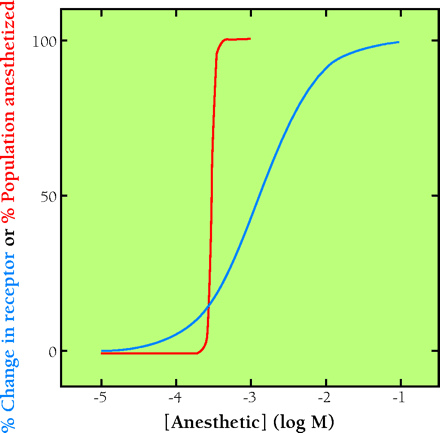
Figure 7.
Typical dose-response curves for a) in vivo anesthesia (red), and b) a typical in vitro response to activation of a single receptor (blue). Note the much steeper curve for anesthesia (Hill coefficient ~20) as compared to a typical receptor curve (Hill coefficient of ~1). Even highly cooperative enzymes or receptors rarely show Hill coefficients greater than about 3 for ligand binding.


