Florence Nightingale: The Biostatistician

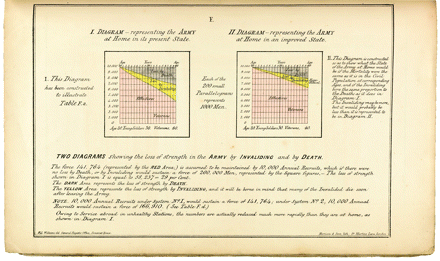
Figure 2
Area chart showing the loss of manpower in the British army due to excess mortality and invaliding
Graphs assume that 10,000 twenty-year-old recruits are added annually and that a healthy soldier’s career lasts twenty years. Shaded areas show the loss of military strength due to deaths (brown) and invaliding (yellow) under the existing unhealthy conditions (left) and the predicted improvements if military morbidity and mortality were the same rates as those found in the civilian population (right). Taken from Florence Nightingale’s Mortality of the British Army (1858).


