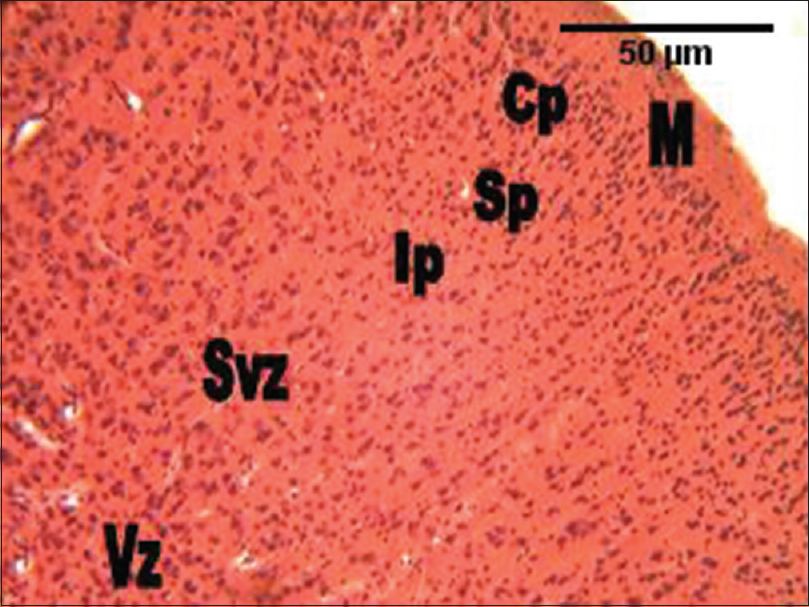
Figure 4: The photomicrograph of the cerebral cortex of the group administered Gongronema latifolium alone showing much cellular density and smaller cellular sizes in all the cortical layers compared with the control group. M = Marginal zone; Cp = Cortical plate; Sp = Subcortical plate; Ip = Intermediate; Svz = Subventricular; and the Vz = Ventricular zones (H and E, ×100)