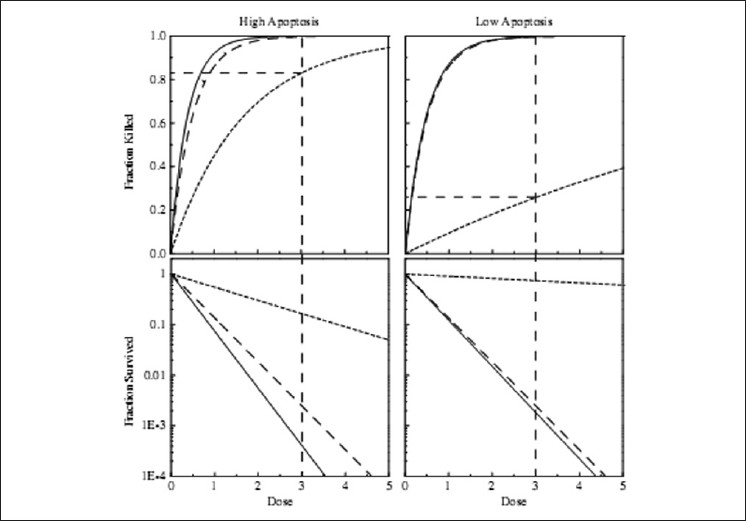
Figure 1: Importance of dose-response relationships for different modes of cell death. Shown are hypothetical dose-response curves for death (upper frames) and survival (lower frames) in response to an anti-cancer agent. The dose-response relationships for overall (solid), apoptosis only (short dash), and non-apoptosis mechanisms (long dash) are shown separately.
