
Figure 1: Changes in spontaneous (●; straight line) and H2O2-induced (☐; dotted line) MN frequencies with increasing age
|
|
Close |
|
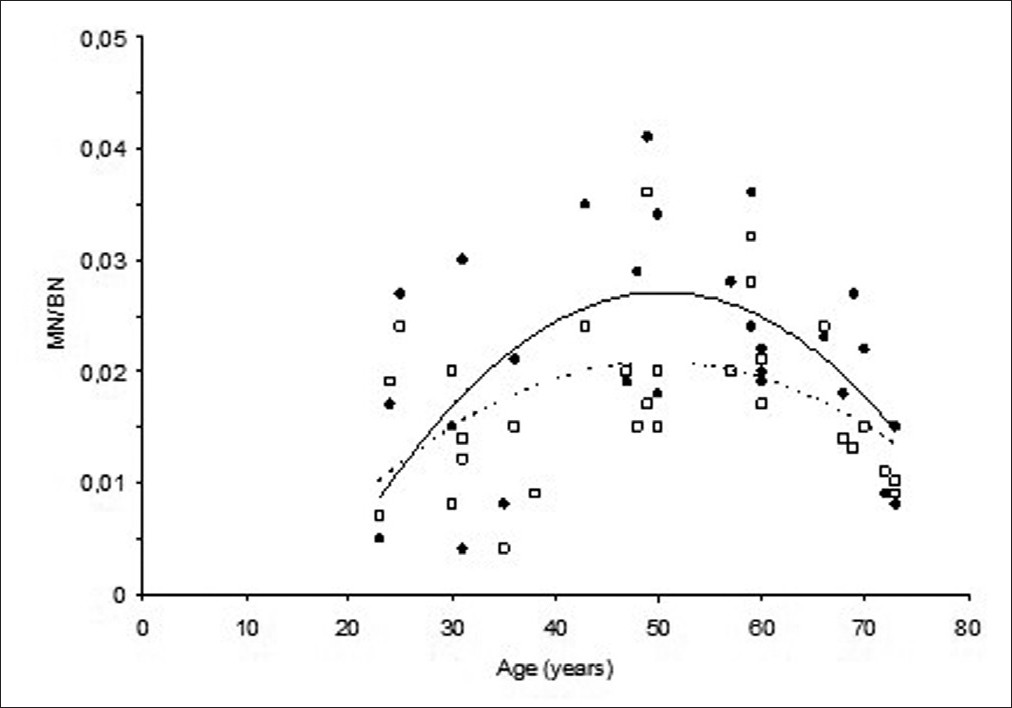
Figure 1: Changes in spontaneous (●; straight line) and H2O2-induced (☐; dotted line) MN frequencies with increasing age
|
|