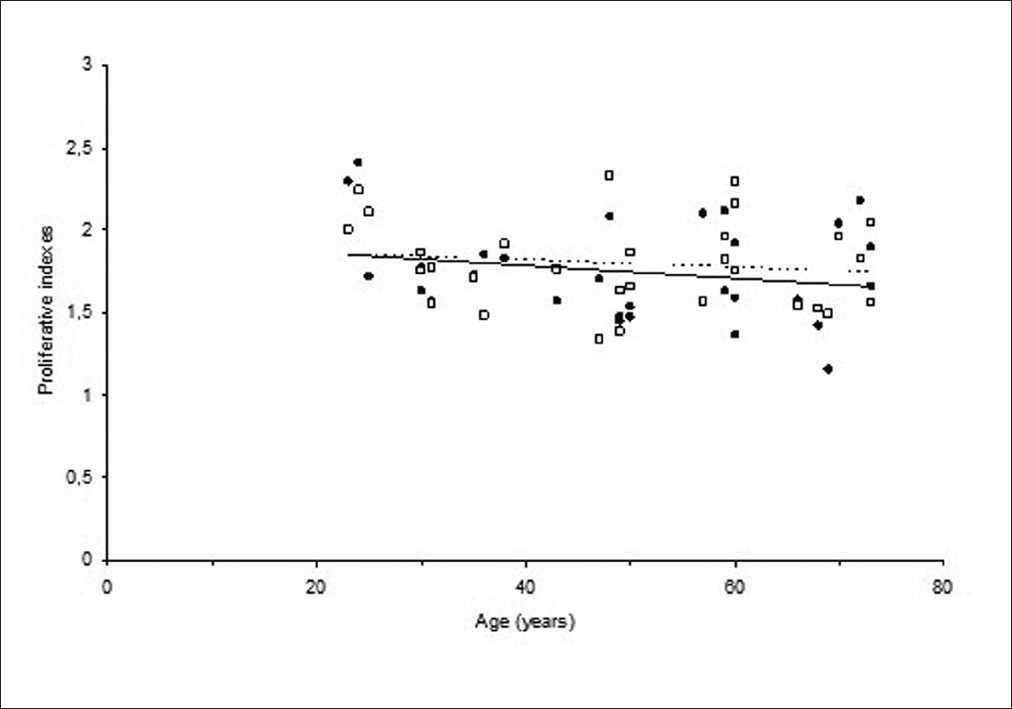
Figure 3: Changes in spontaneous (● straight line) and H 2 O 2 -induced (☐ dotted line) proliferative indexes with an increasing age
|
|
Close |
|
Figure 3: Changes in spontaneous (● straight line) and H 2 O 2 -induced (☐ dotted line) proliferative indexes with an increasing age
|
|