
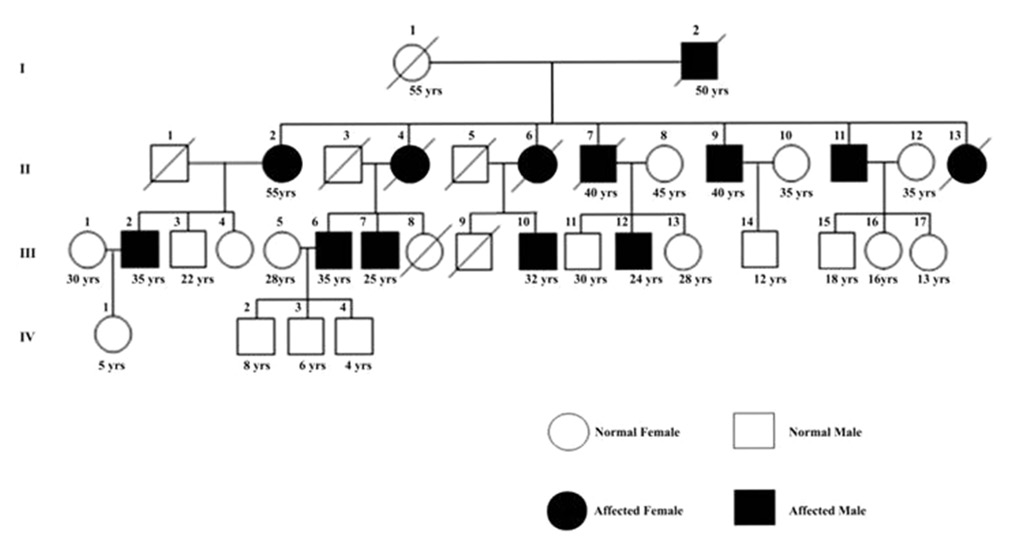
Figure 1: The family tree (Pedigree) of SCA1 affected Individuals. Numbers below symbols indicate the present age. Filled symbols indicate clinically affected individuals
|
|
Close |
|
Figure 1: The family tree (Pedigree) of SCA1 affected Individuals. Numbers below symbols indicate the present age. Filled symbols indicate clinically affected individuals
|
|