Indian J Med Microbiol Close
 

Figure 2: Characterization of the 25 bp deletion in the MYBPC3 gene. (a) Representative agarose gel electrophoresis pattern of the PCR products obtained for the wild-type MYBPC3 (single band seen in Lanes 1, 2, 4 and 5) and a heterozygous deletion sample (two bands corresponding to the wild-type and the 25 bp deletion seen in Lane 3). The marker lane is shown on the right. (b) Representative sequence chromatogram of a heterozygous sample depicting region of heterozygous deletion (Het_del) in MYBPC3 gene viewed as mixed peaks. The control wild type chromatogram without the deletion is shown on the top
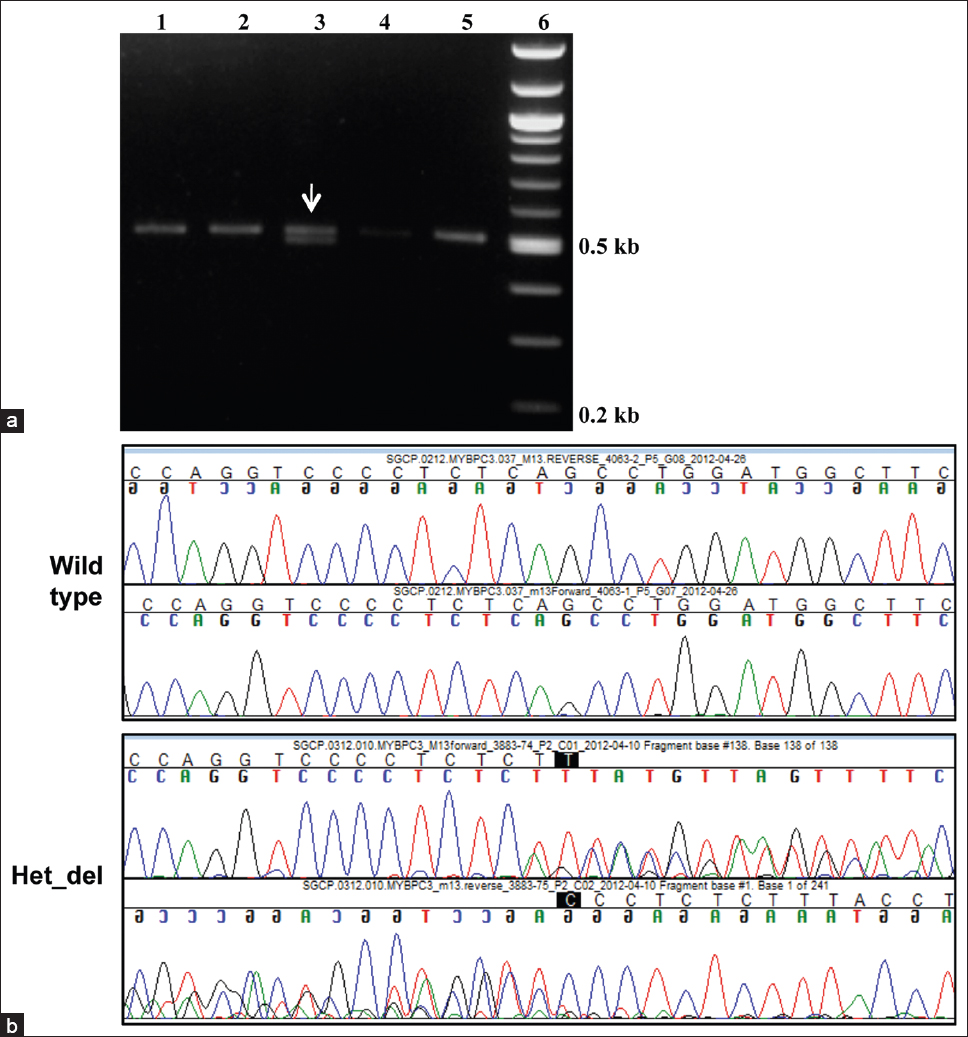
Figure 2: Characterization of the 25 bp deletion in the <i>MYBPC3</i> gene. (a) Representative agarose gel electrophoresis pattern of the PCR products obtained for the wild-type <i>MYBPC3</i> (single band seen in Lanes 1, 2, 4 and 5) and a heterozygous deletion sample (two bands corresponding to the wild-type and the 25 bp deletion seen in Lane 3). The marker lane is shown on the right. (b) Representative sequence chromatogram of a heterozygous sample depicting region of heterozygous deletion (Het_del) in <i>MYBPC3</i> gene viewed as mixed peaks. The control wild type chromatogram without the deletion is shown on the top