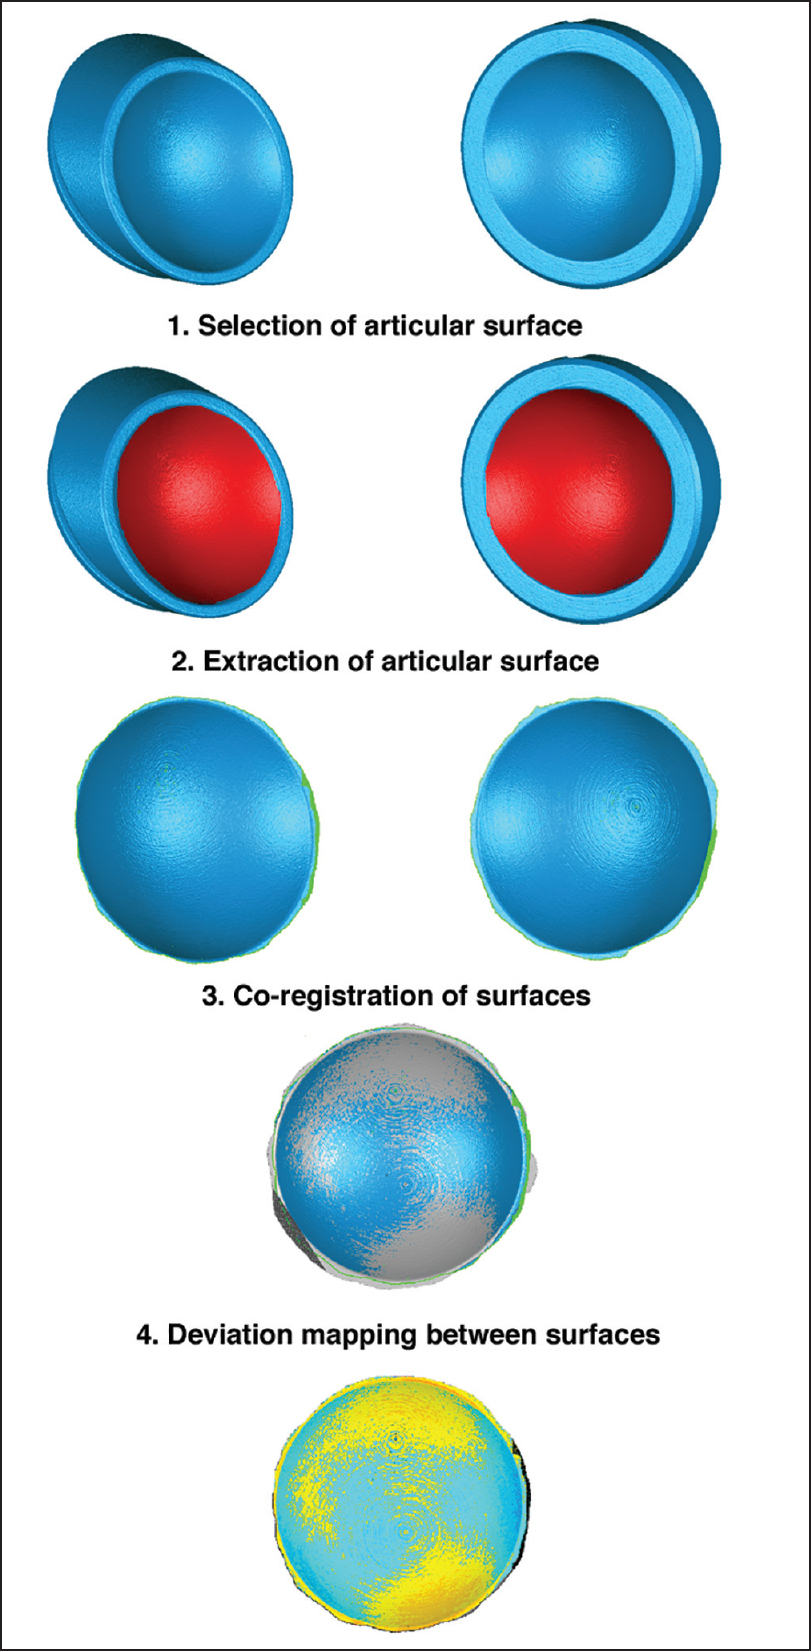
Figure 2: Visual representation of the steps performed by analyzing the articular surface variability between systems


|
Close |
|
Figure 2: Visual representation of the steps performed by analyzing the articular surface variability between systems
|
|