Copyright restrictions may apply. Please see our Conditions of Use.
| ||||||||||
|
Downloading the PowerPoint slide may take up to 30 seconds. If the slide opens in your browser, select File -> Save As to save it. Copyright restrictions may apply. Please see our Conditions of Use. |
|
|||||||||||

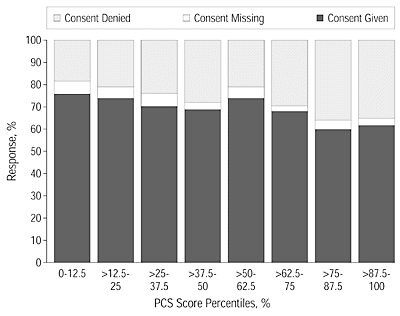
Figure 3. Consent responses and physical functional status. Denial rates are highest in patients with mean 36-Item Short-Form Health Survey Physical Component Summary (PCS) scores above the 75th percentile. Corresponding PCS scores by percentile interval were as follows: 0 to 29.8 (0%-12.5%), greater than 29.8 to 36.0 (>12.5%-25%), greater than 36.0 to 41.8 (>25%-37.5%), greater than 41.8 to 46.2 (>37.5%-50.0%), greater than 46.2 to 50.0 (>50.0%-62.5%), greater than 50.0 to 53.0 (>62.5%-75.0%), greater than 53.0 to 55.9 (>75.0%-87.5%), and greater than 55.9 to 100 (>87.5%).