Copyright restrictions may apply. Please see our Conditions of Use.
| ||||||||||
|
Downloading the PowerPoint slide may take up to 30 seconds. If the slide opens in your browser, select File -> Save As to save it. Copyright restrictions may apply. Please see our Conditions of Use. |
|
|||||||||||

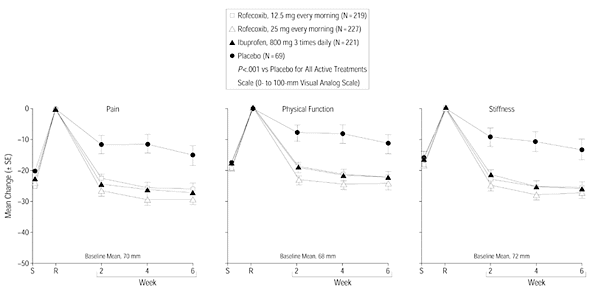
Figure 1. Mean change plots of the primary efficacy end points in the 6-week ibuprofen study. S indicates screening visit; R, randomization visit/baseline assessment.