Copyright restrictions may apply. Please see our Conditions of Use.
| ||||||||||
|
Downloading the PowerPoint slide may take up to 30 seconds. If the slide opens in your browser, select File -> Save As to save it. Copyright restrictions may apply. Please see our Conditions of Use. |
|
|||||||||||

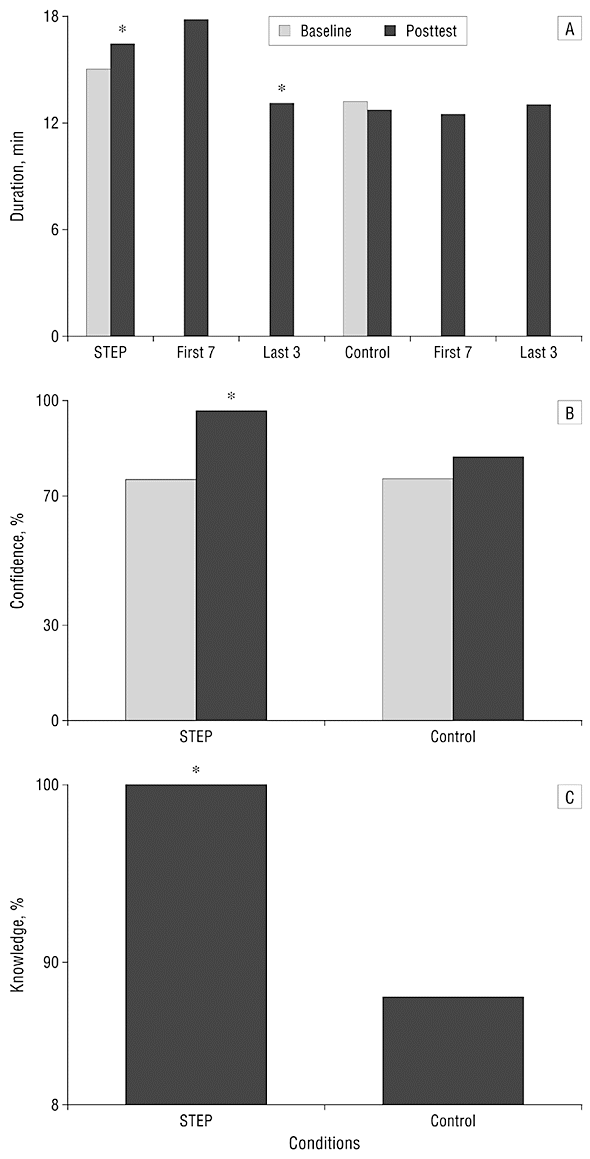
Figure 2. Comparison of key outcome variables by condition (Step Test Exercise Prescription [STEP] vs control) at baseline and posttest. A, Duration represents time (in minutes) spent counseling (last 3 indicates mean time final patients recruited; first 7, mean time of first 7 patients recruited). B, Confidence represents physician confidence using a 0- to 10-point scale, with 0 indicating no confidence and 10, complete confidence. C, Knowledge represents physician knowledge using a 0- to 10-point scale, with 0 indicating perceived complete lack of knowledge and 10, completely knowledgeable. Asterisk indicates significant within-group difference; dagger, significant between-group difference (P<.05).