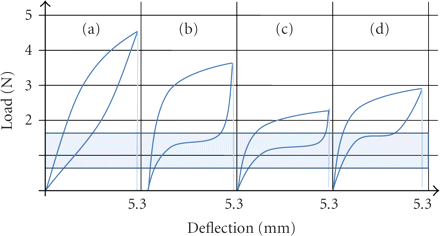
Figure 5
Load-deflection curves obtained in each experimental group are compared to the presumptive biologic corridor range (the two wide horizontal lines). (a) Conventionally ligated Victory bracket, (b) passive self-ligating brackets Damon and SmartClip, (c) active self-ligating bracket In-Ovation, (d) Victory bracket with reduced friction ligatures Slide. Note that in all but the first graph there is a distinct plateau phase.


