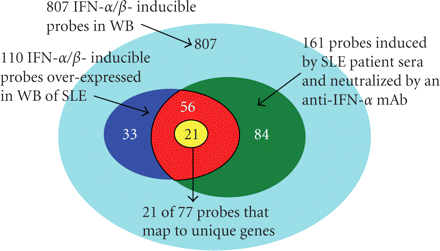
Venn diagram illustrating the three primary analyses used in the selection process of 21 candidate PD markers for anti-IFN-α mAb therapy in SLE: (1) 807 IFN-α/β-inducible transcripts determined from ex vivo stimulation of healthy donor WB with 10 IFN-α subtypes and IFN-β (cyan region); (2) 110 transcripts found to be both overexpressed in WB of SLE patients and IFN-α/β-inducible in WB of healthy donors (combination of blue, yellow, and red regions); (3) 161 transcripts identified by ex vivo stimulation to be induced by SLE patient sera and subsequently neutralized by an anti-IFN-α mAb (combination of green, yellow, and red regions). The intersection of these three analyses provided a list of 77 transcripts, which were ranked by magnitude and prevalence across SLE patients (i.e., percentage of SLE patients with a fold change of at least 2) and the top 21 unique genes were chosen. IFN = interferon; SLE = systemic lupus erythematosus.


