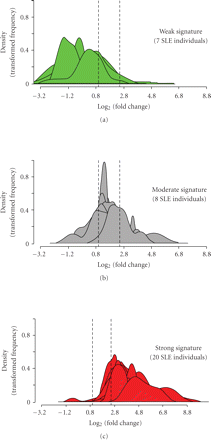
Stratification of 35 SLE patients into groups expressing low ((a) green), moderate ((b) gray), and high ((c) red) IFN-α/β-inducible
gene signaturebased onmedian fold change across the 21-gene panel of IFN-α/β-inducible genes. Kernel density estimates (i.e.,
histograms or frequency plots) for each SLE individual are calculated and graphed using the fold change foreach of the 21
genes from each SLE patient on the  scale to provide a representation of the distribution of 21 gene fold change values. The vertical dashed lines partition
the 3 classes of IFN-α/β-inducible gene signature scores: 7 individuals with a weak IFN-α/β-inducible gene signature = median
fold change <1.91 (0.93 on
  scale); 8 individuals with a moderate IFN-α/β-inducible gene signature = median fold change between 1.91 and 5.53; and 20
individuals with a strong IFN-α/β-inducible gene signature = median fold change >5.53 (2.47 on
  scale). IFN = interferon; SLE = systemic lupus erythematosus.


