Pharmacogenomics of Cystic Fibrosis
- Department of Anatomy, Physiology, and Genetics, and Institute for Molecular Medicine, USUHS School of Medicine, Bethesda, MD 20814; and
- *Molecular Recognition Section, Laboratory of Chemistry, NIDDK, NIH, Bethesda, MD 20892
- Address correspindence to HBP. E-mail hpollard{at}usuhs.milfax; 301-295-1715.
Abstract
Pharmacogenomics is becoming a frontline instrument of drug discovery, where the drug-dependent patterns of global gene expression are employed as biologically relevant end points. In the case of cystic fibrosis (CF), cells and tissues from CF patients provide the starting points of genomic analysis. The end points for drug discovery are proposed to reside in gene expression patterns of CF cells that have been corrected by gene therapy. A case is made here that successful drug therapy and gene therapy should, hypothetically, converge at a common end point. In response to a virtual tidal wave of genomic data, bioinformatics algorithms are needed to identify those genes that truly reveal drug efficacy. As examples, we describe the hierarchical clustering, GRASP, and GENESAVER algorithms, particularly within a hypothesis-driven context that focuses on data for a CF candidate drug. Pharmacogenomic approaches to CF, and other similar diseases, may eventually give us the opportunity to create drugs that work in a patient- or mutation-specific manner.
Introduction
Pharmacogenomics describes the use of genomics in the service of drug discovery. In the present context, we use “genomics” to refer to the transcription profile of all genes within cells, tissues, or organisms (1). This information is also referred to as “the state of the genome.” The action of a candidate drug on the state of the genome can be used to judge whether the agent might affect diseased states in a positive way. This “genomic” approach has seized the imagination of many as an information-rich means for understanding how drugs might work, and therefore, how new ones might be discovered (2). Young has more widely characterized the potential of the expression profile as “an exceptionally powerful means to explore basic biology, diagnose disease, facilitate drug development, and tailor therapeutics to specific pathologies” (3). At very least, the genomic approach offers us the opportunity to gauge the first response of the genome to conditions of challenge. Pharmacogenomics is thus analogous to other methods that determine drug-dependent biological mechanisms as a set of “initial rates.”
Pharmacogenomics is clearly distinct from the related field of pharmacogenetics (4). However, the two fields are complementary, especially in the context of the genetic disease of cystic fibrosis (CF). Classically, the field of pharmacogenetics focuses on mutations in specific genes for transporters, receptors, or enzymes that affect, respectively, the lifetime, activity, or metabolism of a drug. The genes affecting drug disposition have evolved with no regard for drug interactions, and so mutant genes can have primary and secondary effects on the genomics of the patient, that is, both in the absence and presence of an administered drug. In addition, bystander genes, which affect the penetrance of a mutant phenotype, can have their own consequences on global gene expression. Because the state of the genome in CF cells is different from that of normal cells, pharmacogenetic and pharmacogenomic considerations overlap in analyses of global gene expression to search for new CF therapeutics.
Although this review focuses on problems of CF, it is crafted to address scientists whose interests lie elsewhere, and who might look to the relatively well-developed strategies in CF treatment. We appreciate that many scientists may be newly interested in the power of pharmacogenomics and we therefore give certain robust, real-world examples to illustrate concepts that underlie bioinformatic approaches.
Rational Pharmacogenomic Strategies against Cystic Fibrosis
CF is a particularly appropriate problem to approach through the genomics portal because so much is known about the disease. First, the genetic basis for CF is well known. CF is the most common, lethal, autosomal recessive disease in the US and Europe, affecting one in ~2500 live births. It is a classical one gene-one disease (OGOD) disorder (5, 6), arising from mutation of the gene that encodes the cystic fibrosis transmembrane conductance regulator (CFTR). Approximately 5 percent of the population carries one mutant CFTR allele. Secondly, the biochemical and cellular basis of CF has been well studied. Specifically, the principal mutant allele, ΔF508CFTR, affects both the trafficking of the CFTR through the endoplasmic reticulum to the plasma membrane (7, 8), as well as the conductance of chloride ions through the CFTR channel (9, 10). Finally, the clinical symptoms of a malfunctioning CFTR are known to predominate in epithelial cells of the lung, GI tract, and elsewhere (11). In the lung, mutant CFTR can result in an intrinsic and massive proinflammatory phenotype, usually resulting in death. The proinflammatory environment in the lung manifests high levels of the cytokine interleukin-8 (IL8) (12, 13). In fact, high levels of IL8 can be detected in the lungs of afflicted newborns long before pathological signs of inflammation and infection can be detected histologically (14, 15). Thus, the effects of mutant CFTR genes can begin immediately postpartum.
Gene therapy for CF has been successful in vitro (15), which provides the basis for the rational pharmacogenomic analysis of cystic fibrosis. Cell lines have been isolated from affected patients and shown to express the typical CF phenotype. A popular example is the epithelial IB3 cell line, isolated by Zeitlin and colleagues from the trachea of a patient undergoing lung transplantation. Phenotypically, the IB3 cell line exhibits many characteristic CF anomalies. These include a defect in the cAMP-dependent activation of CFTR activity by protein kinase A, anomalies involving local pH and other biochemical properties, and tonic hyperexpression of proinflammatory mediators such as IL8. Moreover, the introduction of the functional (wild-type) CFTR gene into IB3 cells can restore CFTR activity to control levels. Equivalent experiments have been performed with other types of cells. Thus, rational end points are available for evaluating the pharmacogenomic affects of potential CF drugs. On this basis one might envision the ideal CF drug to establish within the CF cell the very same state of the genome that would result from the introduction of a functional wild-type CFTR gene. This vision is the rational pharmacogenomic paradigm in its simplest manifestation.
Current Candidate CF Drugs and the Pharmacogenomic Paradigm
Fortunately, there are a number of candidate drugs available for study, in which the paradigm described above can be applied. One example is the xanthine derivative 8-cyclopentyl-1,3-dipropylxanthine (CPX) (17-21). CPX, currently in phase II clinical trials, binds to CFTR (22) and also improves the trafficking of the ΔF508-CFTR protein to the apical membrane of epithelial cells. CPX also activates mutant and wild-type CFTR chloride channels (23). Other candidate drugs include phenylbutyrate (24, 25), genistein (26), aminoglycoside antibiotics (27, 28), and others (29). Phenylbutyrate appears to work by reducing levels of protein chaperones within the Golgi apparatus, thereby allowing mutant CFTR to progress to the plasma membrane (30). Aminoglycoside antibiotics promote read-through of stop codons, such as are found in the mutant CFTR gene of a small fraction of CF patients. Thus, to the extent that they restore function to cells that express mutant CFTR, these drugs should in some measure effect a genomic signature similar to that manifested upon gene therapy with the wild-type CFTR gene.
The one important caveat to the comparison between drug and gene therapy is that drugs have the potential for side effects. Therefore, we may expect that any given drug, in addition to its effects on CFTR expression and function, will have a unique impact on the genomics of the CF cell, and we must not unreservedly equate the genomics of the drug-treated CF cell with the control cell bearing the wild-type CFTR. Indeed, every patient comes to the genetics table with a unique ensemble of genes that may affect the phenotypic consequences of a defined mutation such as ΔF508CFTR (i.e., the aforementioned pharmacogenetics problem). We should also bear in mind the fact that gene therapy itself may not be free of side effects related to the choice of vector system, the site of sequence incorporation, or level of expression. For example, overexpression of CFTR appears to have its own consequences for global gene expression. These caveats represent complications to the pharmacogenomic paradigm.
“Gene-Mining” Strategies of Drug Discovery
The strategies for identifying the limited number of genes that will be relevant to any given disease (i.e., “gene mining”) have been evolving at a rapid pace. Until recently, technological developments restricted the genomics specialist's sense of accomplishment to the mere compiling of “possibly relevant” genes. The most common approach was to define the “mutant” (or “diseased”) and “wild-type” (or “normal”) sets of genes in terms of the ensemble of mRNAs produced by cells under a given circumstance (e.g., drug treatment) (31). Because of a certain focus on technology, a tidal wave of descriptive information (e.g., a long list of mRNAs whose levels differed by twofold or more between experimentally fixed conditions) threatened to obscure the identification of truly relevant genes.
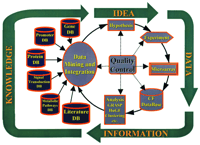
A more systematic approach to pharmacogenomics, and in particular to the pharmacogenomics of CF, can now benefit from hypothesis-driven bioinformatic tools to identify disease- and drug-specific patterns of gene expression. In an iterative scheme (Figure 1⇓), a hypothesis is developed and used to design investigations of cells or tissues. Microarrays are used to analyze the samples, and the resulting data are installed into a database. Once a CF database is generated, specific algorithms are used as bioinformatic tools, extracting meaning out of the data. Some of these tools, such as the hierarchical clustering algorithm (see below), are available within the public domain of the Internet. We have developed two additional tools, called GRASP (for Gene R atio Analysis Paradigm) and GENESAVER (Gene Space Vector) (32, 17). Both are hypothesis-driven techniques, which we shall describe in detail as they have been applied to CF. The analyzed data must then be integrated into the larger scope of bioinformation available through the Internet. In this way, a new, refined hypothesis can be developed for the next cycle of investigation (Figure 1⇓). In our experience, several tactical cycles through this strategic approach have been necessary to develop insight into a given problem.
Hypothesis-driven approach to the bioinformatics of cystic fibrosis (CF). The usefulness of GRASP and GENESAVER algorithms for hypothesis-driven genomic analysis is discussed in the text. The strategy is widely applicable to other diseases.
Gene Mining with the Hierarchical Clustering Algorithm
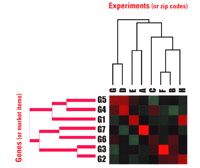
An example of a popular bioinformatic tool is the hierarchical clustering algorithm of Brown, Eisen, and colleagues (33, 34). Without any knowledge a priori, this type of algorithm is used to describe which conditions elicit similar effects on global gene expression. The hierarchical clustering algorithm, which exists in many variations, allows one to enter and analyze expression data as a function of condition. The output is a dual binary clustering of genes on one axis and conditions on the orthogonal axis (Figure 2⇓). Binary clustering means that all entries, or nodes, are systematically interrogated for similarity, and at each stage of interrogation, the closest pair is clustered as a new node on a dyadic tree. Useful results in the field of cancer have been deduced from this approach. For example, two types of B-cell lymphoma have been distinguished through the comparisons of gene expression in dozens of patient samples (35). Various types of human breast cancers have similarly been analyzed and distinguished into subtypes (36), and other diseases have also proven amenable to this “guilt-by-association” approach.
Application of the hierarchical clustering algorithm to genomics and marketing. The origins of the high-quality hierarchical clustering algorithms used for genomic analysis lie in economic analysis. In genomic analysis, patients or experiments are clustered with each other in terms of gene expression. Analogously, customer identifiers, such as zip codes, are associated with purchased items. Optimal associations are formed between nearest neighbors in terms of dyadic branches on a relational tree. We used a random number generator to provide the data example in this figure, and the algorithm provided the array. The graded red and green colors, customary in genomic analysis, represent positive and negative extremes. For example, note the clustering of experiments F and B with respect to their similar sets of colors, and their separation from the disparate color sets of experiments G and D.
We have used the hierarchical clustering algorithm to analyze the effect of the candidate drug CPX on CF (37). As indicated above, CPX enhances the activity and proper trafficking of mutant CFTR. Accordingly, IB3 cells treated with CPX resemble IB3 cells treated with CFTR by gene therapy, and the evidence for this conclusion comes from the application of the hierarchical clustering algorithm, showing that the two conditions (i.e., treatment with either CPX or the CFTR gene) cluster together on the basis of gene expression data. In addition, a similarly close relationship was observed when both CPX- and CFTR-treated cells were exposed to the bacterium Pseudomonas aeruginosa. Challenge with P. aeruginosa is of particular importance for CF because chronic infection with this bacterium is a common mortal affliction of CF patients.
The strength of the hierarchical clustering algorithm lies in the ability to discern an association without having to know the basis of the association; however, this aspect can also be problematic. To explain, we will give here a non-genomic example from the world of marketing. As indicated in Figure 2⇑, supermarket chains often use the algorithm to correlate zip codes (equivalent to the horizontal “experiment” axis) to items purchased (equivalent to the vertical “gene” axis) in order to characterize the buying pattern of a given geographic area. For example, snow shovels and road salt might appear as a dyad in winter sales for Chicago, but not for Houston, and summer sales would lack this dyad altogether. In this way, application of the algorithm allows one to distinguish descriptively northern and southern zip codes on the basis of buying patterns over the course of the year without needing to know about seasons.
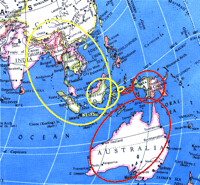
There is another intrinsic caveat in the use of hierarchical clustering algorithms, whether applied to genomics or marketing. Although the analysis is dependable when two genes or conditions are characterized as associated, the method is less dependable when two items fail to be associated. We use a geographical example to make the point clear in Figure 3⇓. Each of two Indonesian islands (small circles) can be “clustered” with respect to larger islands (middle-sized circles), and these clusters can then be clustered with even larger landmasses—in this case, Australia or Asia. From a cursory observation of the dyadic tree, one could erroneously conclude that this clustering analysis “proves” that the original two small islands belong to different continents. After all, each island appears to be part of discrete major nodes, or branches, of the dyadic tree.
Geographical map explaining the weakness of the hierarchical clustering algorithm. Two small islands in the South Pacific (small red and yellow circles) are close together. When grouped with nearby landmasses, however, one of the islands becomes grouped with Borneo, whereas the other is grouped with New Guinea. On a larger scale, the red-ringed island becomes grouped with Australia, whereas the yellow-ringed island becomes grouped with Asia. Thus, the algorithm can map two entities that are in reality quite close as being distal to one another. On the other hand, when the algorithm describes two entities as being proximal to each other, the description is generally very reliable.
Serious misconceptions can also occur in the use of hierarchical clustering algorithms for pharmacogenomics. Again, we can probably rely on results that indicate the clustering together of two genes. However, when the dyadic tree shows certain genes or conditions to be unrelated, additional information should be demanded before relying upon the results. Approaches to solving the problem of false negatives have been described through the use of self-organizing maps (38), but other approaches to gene mining have nevertheless proven necessary.
Development of the GRASP Bioinformatics Tool
Inasmuch as CPX increases the function and trafficking of mutant CFTR, we hypothesized that therapy with either CPX or the CFTR gene should converge on a common genomic consequence. To test this hypothesis, we examined global gene expression in HEK293 cells (i.e., transformed human embryonic kidney fibroblasts), engineered to permanently express either ΔF508-CFTR or wild-type CFTR (32). We found that we were able to distinguish the genomics of the two cell populations. In particular, we were able to identify those effects of CPX that were dependent (or independent) of the mutant gene. In fact, we learned that about 5 percent of the genes examined in the ΔF508 CFTR-expressing cells were affected by the presence of the mutant gene. Thus, too many total genes were contending for our attention.
In order to direct our attention to those genes that are most significantly affected in CF cells, we developed a new bioinformatics tool that we have termed GRASP (Gene Ratio Analysis Paradigm). The essential contribution of GRASP is the use of the statistical power of the complete array of data to quantify changes in the expression of each specific gene. Specifically, significant changes in gene expression are identified according to standard deviations away from the average change of the entire array. GRASP determines changes in expression of the entire ensemble of genes in terms of a normal distribution, and individual changes in gene expression that differ from the average by more than two standard deviations are then defined as significant. Thus, we hypothesize that the average change in expression is a measure of the experimental noise in the system, and that important genes change significantly beyond this experimental noise. We refer to this approach as “statistical genomics.”
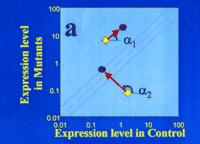
One advantage of the GRASP approach is that several experimental parameters can be systematically combined for analysis. Thus, one is not limited to simply comparing two conditions. For example, as shown in Figure 4A⇓, a graph can be prepared in which one axis shows the ratios of gene expression in HEK293 cells expressing wild-type CFTR relative to unaltered HEK293 cells, and the other axis shows the ratios of gene expression in HEK293 cells expressing mutant CFTR relative to the HEK293 parental cell line. In each case, experimentally manipulated gene expression is normalized to an array of gene expression from a common parental cell line. Note that unaffected genes will thus fall on the diagonal, and affected genes will deviate from the diagonal.
Genomic space as an indicator of the genomic state of cells in response to the drug candidate CPX.
A. Genomic space is defined by a graph of global gene expression levels in HEK293 cells bearing either the wild-type (control; horizontal axis) or mutant CFTR gene (vertical axis). Levels of gene expression that are equivalent in the two cell populations will fall on the diagonal, whereas expression that is affected by the mutant CFTR are off the diagonal. Significant deviation from the diagonal can be defined in terms of standard deviations (see dotted lines on either side of the diagonal). The angle α denotes the direction of “movement in genomic space” in response to CPX; vector length denotes the magnitude of “movement”. The gene denoted by α1 is a mutation-dependent gene (i.e., deviates from the diagonal) whose expression is “moved” by the drug in a mutation-independent manner (i.e., “movement” is parallel to the diagonal). The gene denoted by α2 is a mutation-dependent gene whose expression is “moved” into the diagonal by the drug in a mutation-dependent manner; the drug thus brings the genomic state of the mutation-bearing cells (with respect to the gene denoted by α2) into closer agreement with the wild-type genomic state.
B. Radial plots of a complete data set from HEK293 cells, expressing mutant or wild-type CFTR, treated with CPX. The plot on the left is at low resolution; the plot on the right is at higher resolution. Drug-dependent movement up and down the diagonal is along the 45°/225° angle. Mutation-specific movement is approximately perpendicular to this diagonal. The radius is given in numbers of genes moving at a given angle. (Data are abstracted from (32); sd, standard deviation.)
We now proceed to explain the hypothesis-testing aspect of this algorithm. The area on the graph can be viewed as “genomic space,” and we can ask where treatment with a drug such as CPX might move the expression of any or all genes in the genomic space. This is an important question, because the direction of movement in genomic space can give us insight not only into mutation-dependent effects, but also into the identification of genes that are specifically affected by drugs. In Figure 4A⇑, we focus on the possible actions of CPX with regard to the expression of two specific genes. The effect of CPX (or any other drug) on gene expression can be identified as a change in genomic space; we define changes in genomic space in terms of a specific angle of movement (α), and by a specific “length” of displacement. These two values conform to a classical vector expression, which, in the present context, we can call a “genomic space vector.” An entire data set is shown in Figure 4B⇑, in both low- (left) and high- (right) resolution plots.
We can now interrogate each gene for its response to CPX, evaluate the changes statistically, and select those genes whose change is more than one standard deviation (SD) away from the average change for the entire array. We can graph the results in a radial plot in which the magnitude and direction of each change in gene expression is plotted. Movement along the diagonal is depicted on the 45°/225° angle and represents drug effects that are mutation independent. The most profound such mutation-independent change is in the expression of the protein kinase A regulatory subunit (+6 SDs from the average)(31). Movements that are mutation dependent are in a direction that is generally perpendicular to the diagonal (i.e., into the 90°/180° or 0°/270° quadrants). By means of GRASP, a manageable number of genes showing mutation-dependent CPX effects are discernable (shown as open circles connected by green lines in Figure 4B⇑, right).
Hypothesis-Driven Gene Mining with the GENESAVER Bioinformatics Tool
We have repeated the studies described above (i.e., for HEK293 cells) on the CF tracheal epithelial cell line, IB3. Not surprisingly, we learned that gene expression patterns differed profoundly between the two systems (37). Among the fundamental differences between the two cell types is that the recombinant HEK293 cells vastly overexpress mutant or wild-type CFTR. By contrast, the IB3 cells express mutant CFTR at naturally low levels. Furthermore, the IB3 cells that have been “repaired” with the wild-type CFTR gene via an adeno-associated virus vector also express the wild-type CFTR at naturally low levels. A further contrast is that the IB3 cell secretes massive amounts of the proinflammatory cytokine IL8, thus faithfully mimicking the authentic CF lung phenotype. By contrast, the HEK293 cells secrete low levels of IL8, regardless of the mutational state of the heterologously expressed CFTR. In further studies, we found that either gene therapy with wild-type CFTR or pharmaceutical therapy with CPX suppresses IL8 secretion from IB3 cells. In this respect, the system appears again to faithfully mimic the control condition in the human lung.
These data provided the core idea in developing the GENESAVER algorithm. Specifically, we hypothesized that genes could be identified whose expression precisely and quantitatively correlated with IL8 secretion under a variety of CF-relevant experimental conditions. When IL8 secretion levels rose, we predicted, identifiable genes would be increasingly expressed. Conversely, when IL8 levels fell, the expression of those same identifiable genes would fall. We also reasoned that the GENESAVER algorithm would be useful to mine out those genes that might change inversely, 180° out of phase with the IL8 secretion level. More generally, we propose that any physiological variable can be used as a dynamic compass for teasing out those genes most closely related to changes in that variable. This proposal may sound simple, but mathematical demands become profound for the multidimensional analysis of thousands of genes under many different conditions.
To give a sense of the generality and inherent mathematical complexity of the GENESAVER approach, we can use the relevant topological analogy of weather prediction. For example, knowing that a hurricane has developed in a certain place, at a certain time, we can interrogate all geographic sites reporting weather conditions over the time period leading up to the hurricane. We can then ask which sites changed in parallel with the development of the hurricane, and therefore use this information to predict future hurricanes. In our analogy, IL8 secretion by the CF cell is equivalent to a hurricane, and the reports from the weather sites are equivalent to expression of individual genes in the genome. The analogy is quite fitting.
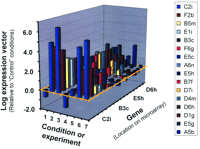
A snapshot of such an analysis for the IB3 CF cell system is shown in Figure 5⇓, depicting the various components of the set of genomic space vectors used by the GENESAVER algorithm to mine out IL8-dependent, CF-related genes. The conditions, or experiments, are depicted along one axis. Each of these entries constitutes a dimension in the multidimensional analysis. The genes interrogated are along the second axis. In Figure 5⇓, only sixteen genes are shown out of the thousands of possibilities. The expression of these genes relative to a control gene is shown on the third axis. These vectors are then compared to the magnitude and direction of the physiological variable, which in this case is IL8 secretion. Using the algorithm, we can sieve out the genes whose vectors in multidimensional space point closely (within a 0-60° solid angle in seven-dimensional space) in the direction of the IL8 vector. In this way, we can identify a cohort of genes the expression of which mirrors that of IL8 secretion over a range of experimental conditions.
Seven-dimensional analysis of genes identified as CF-relevant by the GENESAVER algorithm. Only 16 genes are shown out of thousands of possibilities. The vectors are then compared to the magnitude and direction of a physiological variable, for example IL8 secretion. See text for details.
Of all the genes identified according to the GENESAVER algorithm, those whose vector lengths are less than one standard deviation away from the average can be eliminated by the GRASP algorithm. In the case of the IB3 cell system, many of the genes that remain in the cohort subsequent to elimination by GRASP have turned out to be from the TNFαR/NFκB pathway (37). We can be comfortable with this conclusion because the literature database (see Figure 1⇑) ascribes a role for the NFκB pathway in CF (39). Using multidimensional analysis, genes can be identified that correspond to being “in phase” (~0°) or “out of phase” (~180°) with IL8 secretion. We calculated that the chance likelihood of finding the number of genes that we identified as associated with IL8 secretion, within a 60° solid angle of any given direction in seven-dimensional space, to be one in 10 billion. Thus, the literature database and the statistical power of the GENESAVER algorithm agree.
Conclusions
The GRASP and GENESAVER bioinformatics tools have allowed us to develop novel approaches to the genomic analysis of CF such that specific hypotheses can be tested. Using these tools, we find that the candidate CF drug CPX tends to cause CF-derived IB3 cells to express genes in a fashion similar to CFTR-repaired IB3 cells. Many of the genes that correlate with CF-related patterns of IL8 secretion are found in the TNFαR/NFκB pathway. This conclusion is also supported by the hierarchical clustering algorithm, which makes no a priori assumptions. This pharmacogenomic result is important because it validates CPX as a lead compound for CF drug research, and emphasizes the rationale for interest in CPX in the current clinical trials. Although these data are described specifically for the unique case of CF, the power of any pharmacogenomic experiment will be amplified when there is agreement between inherently different approaches to analysis. We therefore suggest that this approach, using newly described bioinformatics tools, could be usefully applied to other problems.
An additional result from these data, also likely to be generally applicable, is that the expression of mutant and wild-type CFTR is context dependent, so that the genomics of CF may be particular to each patient. This important insight means that therapy for CF, whether by small molecules or genes, may turn out to be specific in regard to both patient and organ. It follows that pharmacogenomic approaches to the disease of CF may eventually give us the opportunity to create therapeutic protocols crafted to the genotypes of individual patients.
- © American Society for Pharmacology and Experimental Theraputics 2001

