Strategizing the Clone Wars: Pharmacological Control of Cellular Sensitivity to Radiation

Figure 1
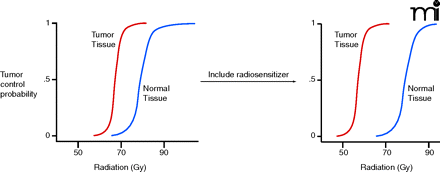
Effects of drugs on radiation exposure. Probabilities of tumor control (red) and normal tissue damage (blue) can be modeled as sigmoidal dose response curves. In the left panel, these probabilities are modeled in the absence of a radiosensitizing agent. The ideal radiosensitizer (right panel) shifts the tumor responsiveness curve leftward (relative to the absence of agent, left panel) while having little effect on normal tissue; drugs that have effects on both normal tissue and tumor may shift both curves to the left (not shown).


