- Institution: Stanford Univ Med Ctr Lane Med Lib/Periodical Dept/Rm L109
- Sign In as Member / Individual
The gβγ Dimer as a Novel Source of Selectivity in G-Protein Signaling: GGL-ing AT CONVENTION

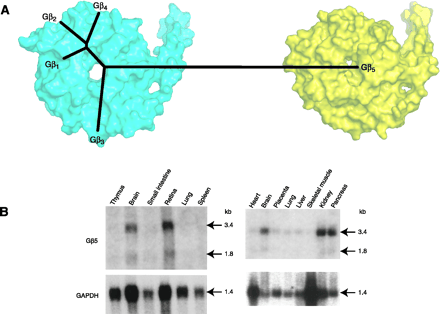
The novel nature of the Gβ5subunit. A. An unrooted dendrogram depicting the relationship among human Gβ subunit protein sequences is superimposed over a space-filling model structure of the Gβ1 subunit (cyan; PDB id 1TBG) and a space-filling model of the Gβ5 subunit (yellow; model coordinates generously provided by Dr. John E. Sondek, UNC-Chapel Hill). B. Northern blot analyses of human Gβ5 transcript expression patterns. Blots of 20 mg total RNA (left) or 2 μg poly(A+) RNA from various human tissues were serially hybridized with a mouse Gβ5 cDNA probe and, as a control for RNA loading and quality, a human glyceraldehyde-3-phosphate dehydrogenase probe. Data adapted from Snow et al. (1998) Proc. Natl Acad. Sci. USA, 95, 13307–13312. Copyright ©1998 by The National Academy of Sciences of the United States of America.


